

Excel builds a Gantt chart from stacked bars. Enter task names, start dates, and durations, then insert a stacked bar chart. Set the Start series to No Fill so the visible duration bars begin at each task's scheduled date.
Use actual Excel dates for the start column and day counts for duration. A date that only looks right but is stored as text can put the bars in the wrong place. Get those inputs right before spending time on chart colors.
Set up the task table and count days consistently
In a blank worksheet, enter Task, Start, and Duration in cells A1:C1. Put one task on each row. For example, use Planning, Build, and Review in A2:A4.
Enter November 9, November 11, and November 16, 2026 as their start dates, with durations of 2, 5, and 2 days. These sample tasks run in sequence and make a useful check on the finished chart.
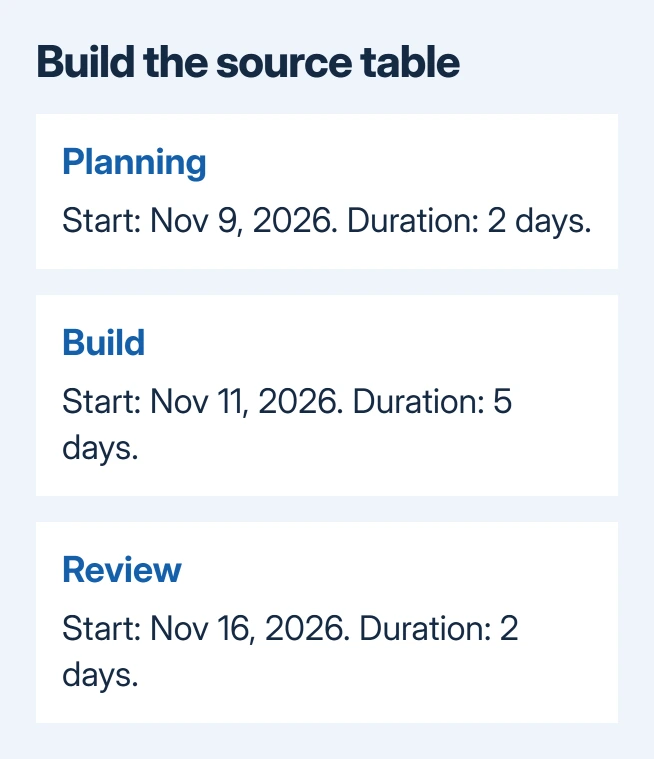
Format column B as a date and column C as a number. If a duration appears as a January 1900 date, its number format is wrong. Change the duration cell to General or Number so it shows its day count.
If your table already has Start and Finish columns, decide whether to count the finish date as a full day. Finish minus Start gives elapsed days. Add 1 when both the first and last calendar day should count as full scheduled days.
For example, November 9 through November 10 is two calendar days when counted inclusively. A formula such as =D2-B2+1 works when D2 is that inclusive finish date and B2 is the start. Count days the same way in every row.
Don't use a working-day count for a bar on a calendar-day axis. A five-working-day task crossing a weekend takes more than five calendar days. Use the planned start and finish dates to work out the duration shown on the chart.
Insert a stacked bar chart using both numeric series
Select A1:C4 for the example. On the Insert tab in desktop Excel, open the bar chart choices and choose the ordinary 2-D Stacked Bar type. Don't select the 100% stacked version.
Microsoft explains in its Gantt chart procedure how to adapt a stacked bar chart. Excel doesn't have a predefined chart type that interprets a project schedule.
On Mac, Insert > Recommended Charts is another route to the Stacked Bar choice. Select the chart type by its name; a clustered bar chart places the start and duration bars beside each other instead of combining them.
The first result can look strange. Dates are stored as serial numbers in Excel, so the Start part of each bar can be much longer than a duration of only a few days. That is the part you'll hide next.
Check that the legend shows Start and Duration, and that each bar has the right task name beside it. If the tasks have become separate series, use Chart Design > Select Data to correct the series and category ranges.
The Excel chart creation steps explain the basic selection controls. Get the source ranges right before hiding anything, because a tidy-looking chart can still use the wrong cells.
Hide the start bars while keeping their spacing
Select the Start series by clicking one of its segments once. All segments in that series should be selected. Open its formatting options and choose Fill > No Fill.
On the Mac ribbon route, select the Start series, open Format > Shape Fill, and choose No Fill. Windows also provides the series formatting pane through Format Data Series on the selected series' context menu.

Leave the Start series in the chart. Its hidden length puts each task at the right start date; deleting it removes that spacing. Each bar needs an invisible Start segment, then a visible Duration segment at the right date on the axis.
Check that the visible segments belong to Duration. If every bar vanishes, you probably changed that series instead. Select Duration in the chart's series controls and restore its fill, then set No Fill on Start.
I prefer to leave the legend visible until this check is finished. Once the correct series is hidden, remove any legend that has become unnecessary or rename the chart to describe the project rather than the chart type.
Put the first task at the top and tighten the date axis
Select the vertical task axis and open Format Axis. Under its axis options, enable Categories in reverse order. Planning should now be at the top, followed by Build and Review in table order.
On Mac, Control-click the task axis and choose Format Axis to reach that setting. Select the task labels rather than a bar; the chart has different options for the data series and its axes.
The horizontal axis may still start far earlier than the project. Open that axis's Format Axis pane and set its Minimum bound near the first task's start date. Use the date's serial value if the bound expects a number.
To get that number, enter =B2 in a spare cell to copy the first start date, then format the spare cell as General. Use the number it shows for the Minimum bound. Keep the original Start column formatted as dates.
Set the horizontal number format to a readable date, and adjust the major unit, the gap between axis labels, to suit your schedule. A weekly interval can suit a project lasting several weeks; a short project may need daily labels.
For date values that aren't behaving as dates, use the Excel date formatting checks. Changing the axis won't repair an input cell that contains date-looking text.
Update the schedule and check what the chart can show
Change one start date and confirm that its bar moves. Change one duration and confirm that the bar grows or shrinks. Those two checks tell you whether the visible chart is still using the input cells you intended.
Adding a task outside your original selection may require expanding the chart's source range. Open Select Data and include the new task label, start, and duration. Check that the final task appears before sending the schedule.
This stacked-bar version shows timing. It doesn't calculate task dependencies, move later tasks automatically when an earlier task slips, or add percentage-complete tracking without further work in the worksheet.
For a chart that resists formatting in a supported desktop version, tell Microsoft Support which control won't work. Include your Excel version and a workbook with sample tasks so support can check the chart or axis.
The Short Version
Create Task, Start, and Duration columns, insert a 2-D Stacked Bar chart, and set the Start series to No Fill. Reverse the task order, narrow the date axis to the project, and check that changed dates and durations move the right bars.
Checked November 9, 2026.

Isaac Smith is the founder and editor of PC Glance, a website that covers computers, laptops, and technology. He is a tech enthusiast and a computer geek who loves to share his insights and help his readers make smart choices when buying tech gadgets or laptops. He is always curious and updated about the latest tech trends.