
Yes, Windows already has tools to monitor your PC's performance. Press Ctrl + Shift + Esc to open Task Manager for a live overview. Use Performance Monitor to choose what to measure and watch how it changes.
I'd start with these tools before installing anything else. They show processor, memory, disk and network activity, so you can see which part of your PC is busy while it's slowing down.
Open Task Manager while the slowdown is happening
Press Ctrl + Shift + Esc, or search Start for Task Manager and open it. Leave the slow app or task running so you can watch what it's doing.
On Windows 11, choose Performance in the navigation on the left. On Windows 10, select the Performance tab across the top. If the older compact view appears, choose More details first.
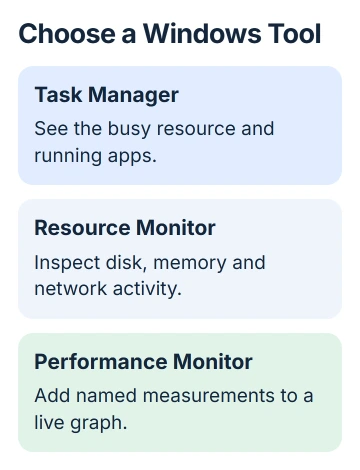
Select CPU, Memory, a disk, or your active network adapter. Each page shows a different part of your PC. A quiet Wi-Fi graph won't tell you much about a calculation that's keeping the processor busy.
Microsoft describes these views and the separate Processes section in its Task Manager reference. Performance shows total use; Processes helps you see which apps are using those resources.
Watch the graph as you repeat the slow action, such as opening a document, and keep watching until it finishes. Notice whether activity drops when the task ends or stays high after you've stopped.
Match the busy resource to the running app
Choose Processes and click the CPU column heading to sort by processor use. Click Memory to check memory use, or Disk when the drive stays busy. Check whether the biggest users are at the top or bottom.
Look for an app you recognize near the top while the problem happens. A browser can have several related processes, so you may need to expand its group to see them. Names and groups vary by program.
Don't end unfamiliar Windows processes just because their numbers change. For an ordinary app, save your work and close it normally first. Then watch whether the slow behavior and resource usage change together.
CPU usage shows how busy your processor is, not how hot it is. Memory shows how much working memory is in use, not free space on your SSD. Knowing the difference helps you avoid a purchase or cleanup aimed at the wrong part.
If a slowdown began with an update, the Windows update performance checks help interpret the activity. Keep the monitoring window open during a repeat attempt so you can compare the same task.
Check the busy resource and the app together. A high total alone leaves you guessing which app is responsible. The first app listed can look busy even when its share of your PC's total resources is small.
Open Resource Monitor for a closer look
Press Windows + R, type resmon, then press Enter. Resource Monitor is another Windows tool, with separate CPU, Memory, Disk and Network tabs as well as an overview.
Use it when Task Manager's graph doesn't give you enough detail. The Disk tab shows which processes and files are using the drive. The Network tab lets you compare processes that are sending or receiving data.
Select the checkbox beside a process to focus on it in views that support filtering. Clear the selection afterward to see the wider view again. With a filter left on, you could miss activity from other apps.
Focus on the task that's slow. If opening a file causes the delay, watch its disk activity. If a download is slow, watch the network view. Checking every number at once makes the useful change harder to spot.
Resource Monitor doesn't need an extra driver or cleanup app. If your work PC blocks it, ask your IT team for access instead of changing security settings.
Add a measurement in Performance Monitor
For a graph of measurements you choose, press Windows + R, enter perfmon, and press Enter. Open Monitoring Tools > Performance Monitor in the left pane.
A counter is a measurement, such as how busy the processor is or how much memory is available. The instance says what you're measuring, such as one processor or the whole system. Together, they tell you what the graph tracks.
Click the green Add counters button. Expand a counter category, select the measurement and the instance you want, then choose Add and OK. You'll see the measurement in the graph and its legend, the list of labels.
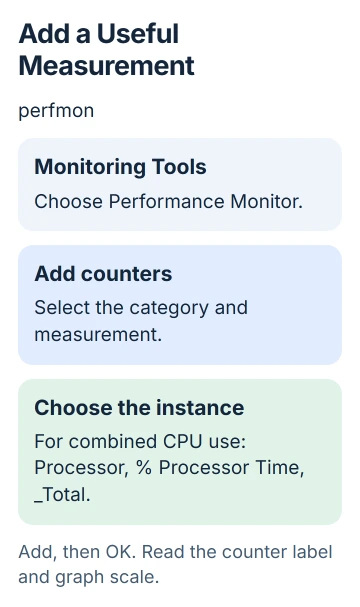
To watch overall processor activity, select Processor > % Processor Time with the _Total instance. Those are the labels on an English installation. They show combined processor use, rather than one app.
Add only the measurements you need. Lines with different units can be hard to compare on one graph. Check each counter's label and scale before comparing how high its line is with another.
The performance counter tools reference covers live viewing and recording logs. Start with a live graph; you may need a log for a slowdown that happens while you're away.
Keep a useful record for the next step
Write down the time of the slowdown, the action that caused it and the resource that became busy. Include the app name if it stayed near the top. These details give a repair conversation something concrete to work with.
When comparing attempts, use the same document or task under similar conditions. A laptop can behave differently on battery and plugged into power, so note which you're using each time.
A screenshot of Task Manager can help when sending a report, but check it for private app names or document titles first. A short description of the same readings can be enough when sharing the screen isn't appropriate.
Temperature is a separate measurement. The PC temperature guide explains the limits of Windows readings, including why a board sensor and a processor-core temperature aren't the same number.
If no busy app explains the slowdown, send your readings to the device maker or IT team. If it keeps happening in one program, contact its support. The readings help you choose a repair; they don't fix the problem themselves.
The Short Version
Task Manager gives the quickest live overview and lists busy apps. Resource Monitor adds detail, while Performance Monitor graphs chosen counters. Compare readings during the actual slowdown and keep the task, time and app name with them.
Checked November 5, 2026.

Isaac Smith is the founder and editor of PC Glance, a website that covers computers, laptops, and technology. He is a tech enthusiast and a computer geek who loves to share his insights and help his readers make smart choices when buying tech gadgets or laptops. He is always curious and updated about the latest tech trends.