
You open Task Manager and the line called System sits at 10, 20 or 40 percent while you do nothing heavy. You cannot end it from Task Manager, and after a restart it soon climbs back.
I would not touch Windows itself yet. System is a container, and the work inside it often belongs to one driver you can name.
On Microsoft Q&A, a 2023 question on it shows 200+ on Same question. The Super User version from January 2013 has 758,129 views.
What runs inside System
System is where Windows runs its kernel and drivers, so a driver's work shows up under that one name. The Super User answer with 310 votes puts it this way: System "loads (or hosts) multiple hardware drivers from different vendors".
That makes it a different entry from System Interrupts, which Task Manager lists apart and which points at your hardware instead.
Ours: here, System is process 4. It runs 495 threads, and over 15 seconds of light use it averaged 1.34 percent as Task Manager counts it, with a peak of 6.54.
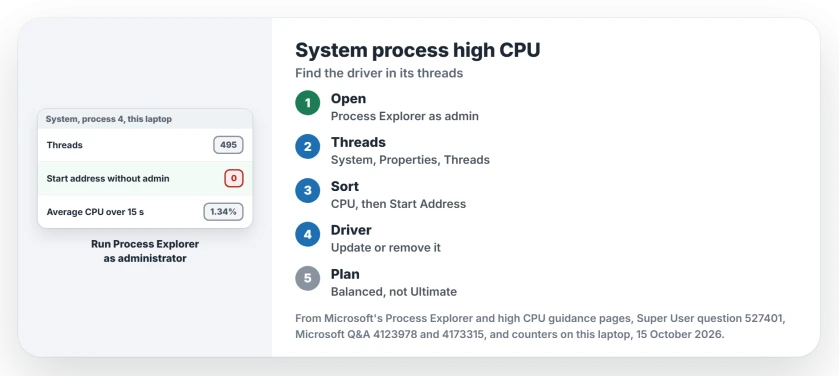
Status: checked 15 October 2026 against Microsoft's Process Explorer and high CPU pages. System's threads and counters were read here without admin rights, on Windows 11 25H2.
1. Open System's Threads tab in Process Explorer
Microsoft's Process Explorer page covers this process. Microsoft states: "If you want to verify an operating system-related process (for example, System), follow these steps".
The steps: run Process Explorer as an administrator, right-click System and choose Properties. Then open Threads and sort by CPU.
The Start Address column names a file. A .sys file there is a driver, and the top one is your suspect.
Do run it as administrator. Ours: as a standard user here, Windows gave every System thread a start address of 0, which tells you nothing.
The tool is free. Microsoft says "The Process Explorer tool is part of the Sysinternals tool suite", so you get it from Microsoft's own site.
2. Update or remove the driver it names
The 2013 asker found theirs this way. In their words, "the process that is eating the most CPU in the system is called Arthurx.sys", the driver for a TP-Link Wi-Fi adapter bought two weeks before.
Owners report the same pattern with other files. A ThinkPad owner traced it to the card reader driver and "solved it by reinstalling the latest one on win 10".
Security software came up three times: Bitdefender's avc3.sys, Avast's aswbidsdriver.sys and a CrowdStrike sensor, and removing the last one took System "from about 15% to almost 0%".
Search the file name first, then get that maker's current driver for your PC. I would update security software before removing it. Windows Security's own engine runs apart, as Antimalware Service Executable, with its own fixes.
3. Check your power plan
A Microsoft Q&A asker saw System climb every time the PC went online. Their plan was Ultimate Performance. After switching to Balanced, they saw System hold at 2 percent or less.
They added one more line: "It was related to minimum processor state". Eight people marked that reply helpful.
To see which plan you run, type this in a Command Prompt:
powercfg /getactiveschemeOurs: this laptop runs its maker's plan, named Performance, with a minimum processor state of 100 percent on mains and 5 percent on battery. System stayed low here anyway. I would treat the plan as one suspect, not the answer.
When no driver stands out, record a trace
Process Explorer shows you a moment, and a busy driver can hide between refreshes, so Microsoft's own advice for high CPU is to "Collect a Windows Performance Recorder (WPR) log while high CPU usage is occurring".
The 310-vote Super User answer walks you through it: WPRUI, First Level, CPU usage, one minute, then Windows Performance Analyzer with symbols, and it shows real cases from Nvidia, Realtek, Intel Wi-Fi and Bitdefender drivers.
Two cases needed no driver update. For MiZeroWorkerPages calls, it suggests turning off Chrome's hardware acceleration. RtlpTestMemoryRandomUp calls meant Windows was testing memory during idle maintenance.
Why is it fine after a restart, then high again?
Because the load builds up, your quick look after a restart can show nothing. The 2013 asker saw about 5 percent after startup, then 40 to 60 percent two to four hours later.
The 2023 asker saw the same shape, fine "for a while and then after 10 minutes the system process starts using CPU again". So open the Threads tab while the number is high, not after a fresh restart.
The Short Version
- System hosts your PC's drivers, so high CPU there is a driver at work.
- Run Process Explorer as administrator and open System's Threads tab.
- Sort by CPU. The .sys file under Start Address is your suspect.
- Update that driver, or remove the security product it belongs to.
- Check for an Ultimate Performance plan, and record a WPR trace if nothing stands out.
Where to Next
Which .sys file topped your list? Post the file name with your laptop or desktop model as a comment, and I can add it to the cases in step 2.

Isaac Smith is the founder and editor of PC Glance, a website that covers computers, laptops, and technology. He is a tech enthusiast and a computer geek who loves to share his insights and help his readers make smart choices when buying tech gadgets or laptops. He is always curious and updated about the latest tech trends.