
Task Manager's process memory figures don't add up to total RAM use because they measure different things.
The app list usually shows private working memory, while the total also includes memory used by Windows, drivers and other system work.
Start with Performance > Memory, then compare its categories with the process list. A gap alone doesn't mean something is secretly consuming RAM.
If the computer is also slowing down, check which category keeps growing before changing settings.
In this guide
1. Compare the same kind of memory
Open Task Manager with Ctrl+Shift+Esc. In Windows 11, select Performance in the sidebar, then Memory. On Windows 10, choose More details if needed, then the Performance tab and Memory.
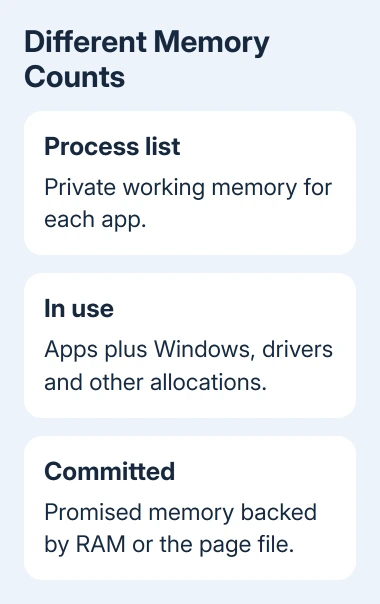
Record In use (Compressed), Available, Committed, Cached, Paged pool and Non-paged pool. Also note Hardware reserved.
These labels describe different parts of memory use. Some overlap, so adding every number together counts some memory twice.
Now open Processes and sort by Memory. Expanding an application group shows its child processes. Don't add a group's total and the same children's values again, because that counts the same application twice.
The process column normally shows a private working set: physical memory currently assigned only to that process. It leaves out some memory shared between processes, as well as memory used by drivers and Windows itself.
Microsoft describes the separate measurements in its browser memory measurements.
Your browser's own task manager can measure memory differently too. Two columns with similar labels won't necessarily count the same things.
If you only wanted to know why the numbers differ, that explains the gap. Keep going if you need to see what's using a large amount of memory or your usual work has become slow.
The network view uses different units: Ethernet readings in Task Manager explain why Mbps can look much larger than a file download rate.
2. Separate available cache from memory in use
Look at Available before deciding the system is out of physical RAM. Available memory includes standby memory, which holds cached data Windows can reuse when an application needs space. It isn't all completely empty memory.
Cached and Available overlap. Adding both to In use counts some memory twice. This is one reason a spreadsheet built from every visible label ends up larger than the installed RAM.
The compressed figure is also part of In use. Compression keeps some memory contents in a smaller form in RAM. Don't add the bracketed compressed amount to In use a second time.
For a different view, press Windows+R, enter resmon, and select Memory in Resource Monitor. Its physical-memory bar separates hardware reserved, in use, modified, standby and free memory.
Read the labels on that bar rather than expecting each color to equal one app. A large standby area can be reusable cache. A large in-use area includes more than the private memory shown in the Processes list.
If the installed total and usable total differ because Hardware reserved is large, use the separate hardware-reserved RAM checks.
That memory isn't being used by a hidden app, so ending browser processes won't free it.
3. Add useful process columns without mixing totals
Open Task Manager's Details view. Right-click a column heading and choose Select columns. Add Working set (memory), Memory (private working set) and Commit size where those choices are available.
A working set is the memory a process currently holds in physical RAM. It can include shared pages, or blocks of memory used by several processes. Adding all working sets can count those same blocks more than once.
Private working set excludes those shared pages. That makes it useful for comparing apps' private RAM use, but it still doesn't become a full system total. Changing the column won't turn it into a complete breakdown of RAM use.
Commit size shows private memory a process has requested that Windows must support with RAM or the page file, a file on disk used for memory. The whole amount isn't necessarily in physical RAM right now.
Watch a suspected process during a repeatable task, such as opening and closing the same document. Note whether its memory settles or keeps climbing after the task ends. One snapshot can't show a continuing rise.
I'd save the document and close the suspected app normally before ending anything through Task Manager. Reopening it gives you a practical comparison while protecting unsaved work.
4. Use RAMMap when Windows holds the missing share
If the app list still leaves a large unexplained amount, download RAMMap from Microsoft Sysinternals.
It shows which parts of physical RAM the ordinary process totals leave out.
Extract the download and run the version for your computer. Accept the license prompt and approve administrator access if requested. The tool's Use Counts tab shows what RAM is used for and the state of each group of memory pages.
Compare Process Private, Mapped File, Paged Pool, Nonpaged Pool and any other rows using a large amount of RAM. Use Processes for process working sets and File Summary to see cached data grouped by file.
Refresh the display when comparing a later reading. RAMMap is showing a snapshot, so an unchanged window doesn't necessarily mean current memory use is unchanged.
A growing nonpaged pool points toward memory used by the system and drivers. It doesn't identify the particular driver by itself.
Record the growth and any recently changed device or driver instead of assuming the largest ordinary app caused it.
Check what's using the RAM before running any command that empties memory lists. Clearing a category changes what you can see without explaining why it grew.
5. Treat actual pressure separately from the accounting gap
Return to Performance > Memory and inspect Committed. The first number is the memory Windows has promised to provide; the second is the limit it can support.
Microsoft's page-file explanation describes failures when that limit is reached.
If the first number gets close to the limit while apps freeze or report that they can't get memory, use the low-on-memory warning guide.
That warning needs different treatment than a harmless mismatch between process totals and physical RAM.
For a growing driver-related category, save open documents, then restart Windows. Repeat the normal task and record whether the same category climbs again.
A drop after restarting tells you that memory was freed. The cause of that growth still needs checking.
Give your PC maker or IT team the Windows version, RAMMap category, readings over time and the action that triggers growth. Include any recent driver change.
Ask them to trace what's using that memory rather than requesting a generic memory cleaner.
The Short Version
Private process memory isn't total RAM use. Compare matching measurements, avoid counting cache or compression twice, and use RAMMap for system allocations.
Only pursue a repair when a category keeps growing or the machine shows real memory pressure.
Checked November 13, 2026.