
Excel repair warnings about charts across several workbooks can point to an Office fault rather than damage to each file. Keep the original workbook untouched, update Office, and check whether a new blank workbook can insert a simple chart.
A 2019 fault affected computers using non-English regional settings, and repairing the files could remove their charts. A single broken workbook needs recovery; charts failing in every workbook need the Excel installation checked first.
In this guide
1. Keep the original file and update Office
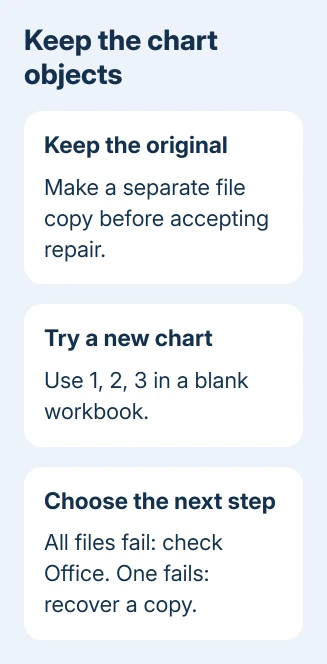
Before accepting a repair that removes charts, duplicate the affected workbook through File Explorer. Work on that copy. A repaired file saved over the original can leave you without the chart objects you wanted to recover.
Open Excel without opening the problem file, then choose File > Account. Note the product name and open About Excel for the full version and build. Under Update Options, choose Update Now if that option is available.
Keep other Office work saved before apps close for updating. On a company-managed PC, send IT the build and request a check of its deployed Office release.
After Office updates, open the duplicate workbook. If the charts now load normally, check the sheet data and chart series before saving a new copy. Keep the original until those checks confirm your recovered copy has what you need.
In the 2019 chart-failure discussion, owners reported Version 1903 Build 11425.20202 and failures across Excel, Word, and PowerPoint. The final support update marked incident MO177791 resolved.
That incident is historical. It doesn't mean every current chart error is the same bug, and its old rollback builds aren't suitable versions to install on a working PC today.
2. Try inserting one chart in a new workbook
Create a blank workbook. Enter a heading in A1 and the numbers 1, 2, and 3 in A2 through A4. Select that small range, open Insert, and choose a basic column chart from the Charts group.
A chart with three columns should appear. If it appears, Excel can create an ordinary chart in this session. Next, compare the file and chart type that failed with this working example.
If the chart preview is blank or inserting it fails, save the exact message. That points to a problem beyond the old workbook: this new file doesn't contain any of its charts, links, or PivotTables.
For a refresher on selecting a simple range, the Excel chart steps show how the source cells connect to the chart. An empty selection isn't the same failure as Excel failing to plot valid numbers.
The owners in the old discussion couldn't insert charts even in new workbooks. Safe mode and reinstalling Office didn't fix it for several of them. Start by checking the app instead of repairing each workbook.
If ordinary charts work but only one PivotChart fails, preserve its PivotTable and source information for support. A PivotChart uses a PivotTable's summarized data, so include the connection details in your report.
3. Use the regional workaround only for the old matching case
The old incident included a specific workaround for non-English regional settings. Use it only when checking that old build with the same chart failure. Don't change Windows region just because a file won't open.
Close every Excel window and note the current country and regional format. On Windows 10, open Settings > Time & Language > Region. Set Country or region to United States and Regional format to English (United States).
On Windows 11, the corresponding controls are in Settings > Time & language > Language & region. They are separate from the Windows display language; the workaround doesn't require changing the language of the whole desktop.
If the older layout doesn't show the format control, open Control Panel > Clock and Region > Region. On Formats, choose English (United States). This matches the alternate route included in the historical instructions.
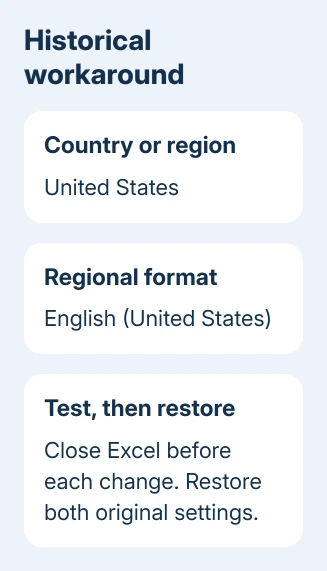
Reopen Excel and repeat the small column-chart check. Then close Excel, restore the original country and format, and test again. The published workaround included restoring the original settings.
Regional formats affect dates and number display in other apps too. Use this only as a short comparison, and keep the original settings so the computer can return to its normal format.
If a current supported build fails, give support its version and both chart results. Ask whether there is a current known issue before adopting an old regional workaround or arranging an Office rollback.
4. Recover the file when new charts work
If new charts work, try the untouched file on another updated Excel installation. If it opens there, save a separate copy after checking the charts. One owner could open the affected files on another PC and in Office online.
With OneDrive or SharePoint storage, open Version history for a copy from before the charts disappeared. Restore or download that version through the service, keeping your current work for comparison.
For an ordinary workbook saved locally, Microsoft's workbook repair instructions use File > Open > Browse. Select the copied file, open the menu next to Open, and choose Open and Repair.
Choose Repair first. If that can't recover the workbook, Extract Data tries to retrieve the cell values and formulas. Recovering cell data alone won't bring back the chart objects or formatting.
Read any repair log before assuming the file is fully recovered. If it says drawing records were removed, compare the charts and report layout with a known good copy. Saving an opened file doesn't mean all of its content survived.
I'd recover the original chart from a good version before rebuilding it by hand. For a basic chart with intact source cells, the bar-chart guide can help if recreation is the practical last step.
When the failure needs a support case
Include the Excel build, regional format, warning, and blank-workbook result in your support ticket. Include whether Word or PowerPoint charts fail too, and attach a small example stripped of private data.
Request a check for current chart-loading incidents before repairing Office or returning to an earlier build. If only one file fails, send the repair log and explain which version last contained intact charts.
The Short Version
Keep an untouched original and update Office. Check chart creation in a blank workbook. Treat widespread chart failures as an app problem first. Use version history or repair on a copy when the trouble remains limited to one workbook.
Checked November 17, 2026.