

To find the standard error of a sample mean in Excel, enter =STDEV.S(A2:A11)/SQRT(COUNT(A2:A11)) with your data range. It divides the sample standard deviation, which measures spread, by the square root of the number of values.
Standard error of the mean (SEM) describes how uncertain the estimated mean, or average, is. Use the formula for a live worksheet result, or desktop Excel's Analysis ToolPak for a summary table.
Calculate the standard error of the mean
Put one set of observations in a column, with a descriptive heading in the first row. Keep the values for that group together. A total, an average, or a note mixed into the range can change the calculation.
Select an empty cell outside the data and enter =STDEV.S(A2:A11)/SQRT(COUNT(A2:A11)). Press Enter. If your workbook uses semicolons between function arguments, you don't need to change this formula: each function takes just one input.
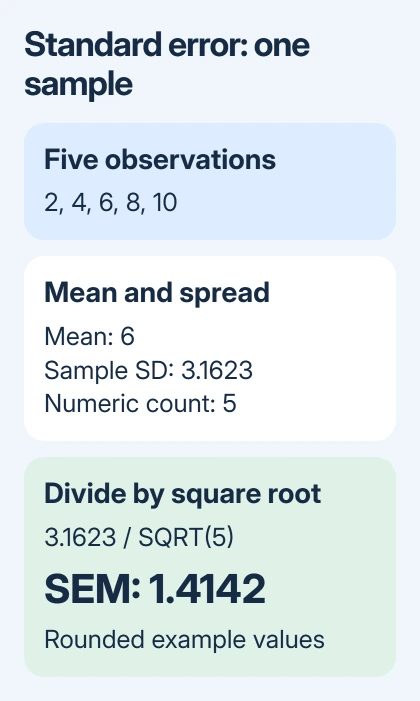
STDEV.S calculates the sample standard deviation. COUNT counts numeric cells in that same range. SQRT takes the square root of that count. The division combines those three pieces into the standard error of the mean, often shortened to SEM.
Keep every range identical. Dividing the standard deviation of A2:A11 by the count of A2:A20 would mix two different sets of observations. Excel can return a plausible number even when the formula's references don't match.
Microsoft explains the sample calculation in its STDEV.S reference. For a fuller look at that part of the formula, use the sample and population standard deviation examples.
The formula works in current Excel for Windows, Mac, and the web without an add-in. Localized Excel may use translated function names; try the function suggestions or Insert Function if an English name isn't accepted.
Check the result with a small example
Enter 2, 4, 6, 8, and 10 in cells A2 through A6, one number per cell. Then enter =STDEV.S(A2:A6)/SQRT(COUNT(A2:A6)) in another cell. The result is approximately 1.414213562.
For those five observations, =AVERAGE(A2:A6) returns 6. The sample standard deviation is approximately 3.162277660, and the count is 5. Dividing that standard deviation by the square root of 5 gives the SEM.
Label the result Standard error of mean so anyone reading your sheet knows what the number means. A heading that says only Error could mean a formula error, a confidence interval, or another kind of statistic.
Use Home > Increase Decimal or Decrease Decimal to choose how many decimal places you see. That changes the cell's appearance, not the underlying calculation. Keep the full result available when another formula needs it.
I'd check this example before using the formula in a large report. If it agrees but the real data doesn't, check which cells the formula uses, whether the entries are numbers, and how you've grouped them before trying another SEM function.
Check numeric cells before trusting the count
Enter =COUNT(A2:A11) in a spare cell and compare its result with the number of observations you intended to include. COUNT counts numbers, including zero, while ignoring empty cells and text in a referenced range.
A blank isn't a zero. If one measurement is missing, handle it as missing data in your analysis plan rather than entering 0 to make the column look complete. A real zero belongs in the calculation and affects both spread and count.
Numbers imported as text can also be skipped. Select a suspicious cell and check for Excel's number-stored-as-text warning. Use Convert to Number when that warning appears and the entry really is a measurement.
Recheck COUNT after conversion. A change from 8 to 10 tells you that two entries are now being treated as numeric observations. Check the SEM again because both the spread and the count used in the formula can change.
An error value in the range can stop the calculation. Fix that input instead of using IFERROR to hide it. The formula needs usable measurements. Hiding a broken input behind a blank result won't fix your calculation.
A sample standard deviation needs two or more numeric observations. For #DIV/0!, check the count and range first. A copied formula pointing at a heading instead of measurements can't supply that sample.
Create a summary table in desktop Excel
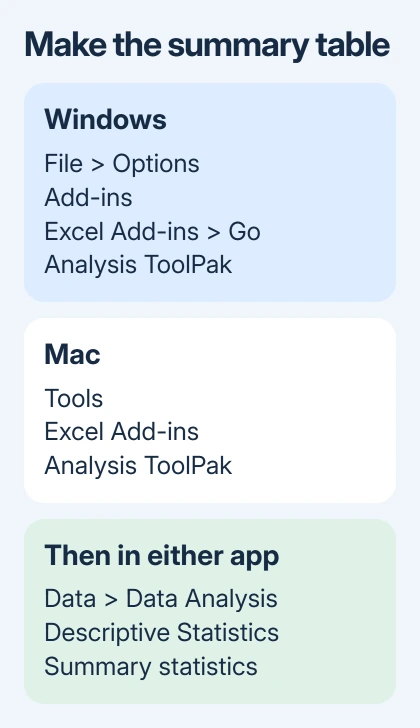
For several statistics together, use Analysis ToolPak. On Windows, open File > Options > Add-ins. Set Manage to Excel Add-ins, select Go, check Analysis ToolPak, then select OK.
On a Mac, open Tools > Excel Add-ins, select Analysis ToolPak, and choose OK. Quit and restart Excel if needed to make Data Analysis appear on the Data tab. The Windows and Mac menus differ, but you'll get the same analysis.
Choose Data > Data Analysis > Descriptive Statistics. Set Input Range to your observations. Choose Columns for data arranged vertically. If the selected range includes the heading, check Labels in first row.
Choose where to put the report, leaving enough empty cells, or use New Worksheet Ply. Check Summary statistics, then select OK. Find Standard Error in the resulting table and compare it with the formula for that same set of observations.
The report also includes measures such as Mean, Standard Deviation, and Count. Check those alongside Standard Error when the result surprises you. A wrong range or an included total can affect every entry in the report.
The report uses the data you selected when you ran the analysis. Rerun the analysis after changing the input. Use the worksheet formula when the SEM needs to recalculate automatically as existing input cells change.
Excel for the web can use the formula directly. Don't spend time looking for the desktop ToolPak controls in its ribbon; use the desktop version of Excel if you need that specific report.
Keep SEM separate from chart bars and regression errors
For grouped measurements, calculate each group's SEM using only its own measurements. Don't take the spread of several group averages and assume it equals the uncertainty within every group. The rows behind each average matter.
A chart's built-in Standard Error option isn't a substitute for supplying separately calculated amounts for each group. Use custom error bars when each plotted mean needs its own SEM value.
Regression output also uses the words Standard Error for other quantities. If an assignment asks for a coefficient's standard error or the standard error of prediction, the sample-mean formula isn't the requested calculation.
If the result still doesn't match the expected answer, give the analyst your formula, count, required statistic, and a sample without identifying details.
If an Excel feature fails, send support your edition and a small workbook showing the fault.
The Short Version
Divide STDEV.S of the observations by SQRT of COUNT of the same observations. Check the numeric count, keep groups separate, and use Descriptive Statistics in desktop Excel when you need a full summary table.
Checked November 9, 2026.

Isaac Smith is the founder and editor of PC Glance, a website that covers computers, laptops, and technology. He is a tech enthusiast and a computer geek who loves to share his insights and help his readers make smart choices when buying tech gadgets or laptops. He is always curious and updated about the latest tech trends.