

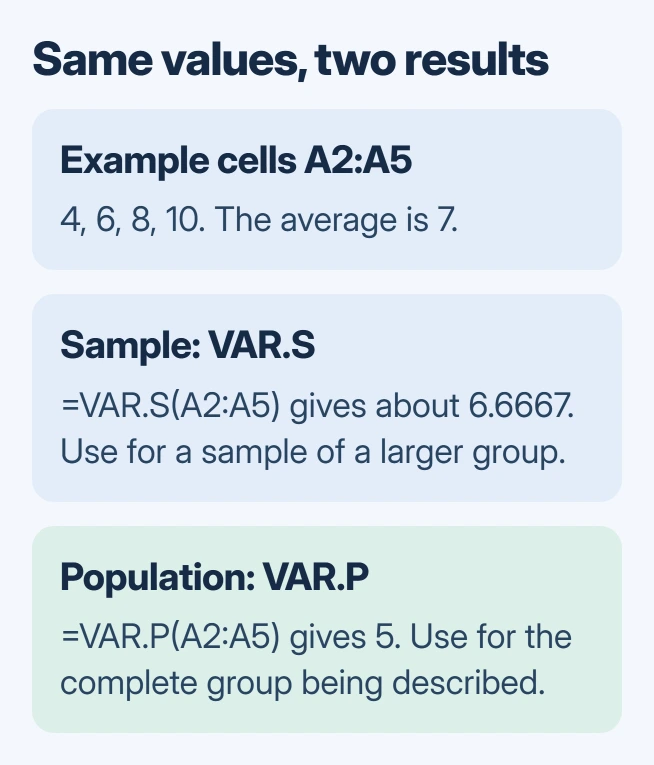
To find variance in Excel, enter =VAR.S(A2:A5) when the numbers sample a larger population. Use =VAR.P(A2:A5) when they cover the entire group being described. Replace the cell range with the observations in the worksheet.
Both functions measure spread around the average, but they use different divisors. Choosing the function is a decision about the data, so adding more rows does not automatically turn a sample into a population.
Match the function to the question being answered
Use VAR.S for measurements collected to represent a larger population, such as selected deliveries from a month's work. Use VAR.P if the report describes every delivery in the group of interest.
Microsoft documents that distinction in its VAR.S function reference. The same cells can produce different valid results because the sample calculation estimates a larger population's variation.
Status: VAR.S and VAR.P documentation reviewed November 2, 2026. The teaching example was checked with Python arithmetic, not by operating Excel.
If variance means the difference between actual spending and a budget, that is a different calculation. Subtract the budget from the actual amount. The statistical functions here describe the spread of a collection of observations.
Enter four numbers and verify the formula
In a spare worksheet, type Value in A1. Enter 4, 6, 8 and 10 in A2, A3, A4 and A5 respectively. These are invented example measurements, with one observation in each cell.
Click a blank result cell outside that range, type =VAR.S(A2:A5), and press Enter. Excel should return approximately 6.666666667. In another blank cell, enter =VAR.P(A2:A5); the result should be 5.
The average of these four values is 7. Their squared distances from 7 add to 20. Dividing 20 by three produces the sample result, while dividing by four produces the population result.
Microsoft states that VAR.P uses the full population. Keep the chosen label beside the output so another person can tell which calculation the workbook uses.
For real data, select only the observations. Leave totals, averages and previous variance results outside the range. If copying the formula across several groups, check how Excel adjusts copied references.
Why does Excel count fewer values than expected?
Type =COUNT(A2:A5) in a separate cell. The example must return 4. Microsoft says COUNT counts numeric cells, making it useful when imported values look numeric but are stored as text.
In a referenced range, VAR.S and VAR.P ignore empty cells, text and logical values. A numeric zero is included, so replacing an unknown measurement with zero changes the calculation rather than filling a harmless gap.
For a sample variance, at least two numeric observations are needed. With fewer, the sample denominator cannot produce a valid estimate and #DIV/0! can appear. Check the selected range and its numeric count before hiding that error.
If Excel counts fewer observations than expected, inspect imported cells and convert numbers stored as text where appropriate. Preserve the source data so accidental conversions can be reversed.
Report variance in the correct units
Variance uses squared units. Measurements in minutes produce a result in square minutes, so the example's population variance is 5 square minutes if those values represent times.
For a spread measure expressed in minutes instead, calculate standard deviation in Excel. It is the square root of the corresponding variance, not an interchangeable label for the same output.
Show enough decimal places for the report rather than rounding each input first. If the example works but the actual calculation does not, compare the formula range, numeric count and input units before changing functions.
For missing decimal digits, separate Excel's display format from actual rounding so the variance keeps the precision its inputs provide.
For a persistent formula error, provide Microsoft Support with a small nonprivate example and the exact formula. Ask the person requesting the analysis which population the result should describe if that part remains unclear.
The Short Version
VAR.S estimates variance from a sample; VAR.P describes the whole population. Check the range with COUNT, keep missing values separate from zeros, and label the output with squared units.

Isaac Smith is the founder and editor of PC Glance, a website that covers computers, laptops, and technology. He is a tech enthusiast and a computer geek who loves to share his insights and help his readers make smart choices when buying tech gadgets or laptops. He is always curious and updated about the latest tech trends.