

A tiny Excel chart that won't resize on its own chart sheet can come from the default printer setup. Choose an available Windows default printer and restart Excel. Several owners fixed it without rebuilding their charts.
This fits a chart that becomes small on its own tab but looks normal inside a worksheet. Missing data or small labels alone need different checks. Try the printer before changing the chart's data or design.
In this guide
1. Give Windows an available default printer
Save the workbook, then exit Excel. Check which printer Windows uses by default. The original owner reports included a missing default printer and a network printer that wasn't available away from its network.
On Windows 11, open Settings > Bluetooth & devices > Printers & scanners. Turn off Let Windows manage my default printer, select an available printer, then choose Set as default.
On Windows 10, open Settings > Devices > Printers & scanners. Clear Let Windows manage my default printer, select the printer, choose Manage, then Set as default. Its status should change to Default.
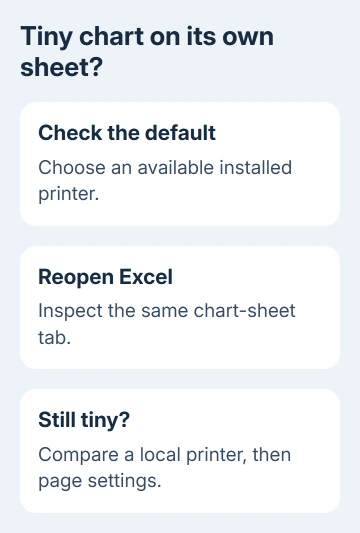
For the original Windows 7 setup, open Start > Devices and Printers. Right-click the available printer and choose Set as default printer. Use an installed printer you recognize rather than adding an unknown driver for this check.
The current default-printer instructions also explain why the default button can be missing when Windows manages the choice automatically. Turn that setting off before selecting a fixed default.
Reopen Excel and the affected workbook, then select its chart-sheet tab. If the graph now fills the page normally, changing the default printer helped. Check another affected workbook before editing individual chart settings.
If it remains tiny, keep the new default for the next comparison. Simply zooming the chart wasn't enough in the original report, so don't keep adjusting zoom in place of checking the printer choice.
2. Compare an installed local printer with the network one
If the current default is a workplace network printer, try an available installed local printer instead. When Microsoft XPS Document Writer is already listed, it can serve as a comparison without needing a physical printer online.
One owner fixed the chart size through the Microsoft forum's printer workaround by choosing XPS Document Writer as default. Another reported trouble with a network default when the computer wasn't connected to that network.
Close and reopen Excel after making the change, then inspect the same chart sheet. Leave your workbook and chart unchanged during this check. That makes the effect of switching printers easier to see.
I'd try an existing local printer before repairing Office. It takes less time, and owners confirmed that changing the printer fixed their charts. An Office repair had already failed for the asker whose charts became tiny.
If the local choice works, ask IT or the printer maker to check the normal printer's driver and availability. Explain that Excel chart sheets shrink with that printer selected and recover with the local choice.
Don't install XPS Document Writer just to match a printer named in an old reply. If it isn't present, use another suitable printer already installed or ask IT for a supported comparison on that PC.
3. Check the chart sheet's paper size and margins
With the affected chart sheet selected, inspect Page Layout > Margins and try Normal. Check Page Layout > Size and choose the paper you intend to use, such as Letter or A4.
Open File > Print and inspect the preview without printing. Look for a chart that occupies the intended page area rather than a small graph surrounded by excessive margins. Confirm that the selected printer is the one you just tested.
Check the margins after trying the default printer. Excessive margins leave less room on the printed page; check that your paper settings leave enough room for the chart's title and labels.
If only one chart sheet looks wrong while others display normally with the same printer, compare their paper size and margins. I'd check those settings before deleting the chart or changing every workbook.
For an existing chart whose data is wrong, revisit how Excel charts use selected data. Page settings won't correct an incorrect range or an empty series.
When the series exists but Excel graph lines disappear, try the chart-type repair on a copy before rebuilding the annotations.
If the chart still shrinks with an available default and ordinary page settings, try moving a copy into a worksheet. Keep a saved copy before changing where the chart lives.
4. Move a copy into a worksheet when you need it now
In desktop Excel, select the chart and open Chart Design > Move Chart. In older Excel, the tab is named Design under Chart Tools. Choose Object in, select a worksheet, then choose OK.
The chart becomes an object on that worksheet instead of filling a separate chart sheet. Select its outer edge and drag a corner sizing handle to adjust its size. Check its title, legend and labels after resizing.
The original asker reported that moving the chart into a worksheet made the whole chart visible again. Moving it back to a new chart sheet made it small again, which is why this is a temporary layout workaround.
Work in a copy if colleagues or printed reports still need the original chart-tab arrangement. Moving it changes where people find it, even though the plotted data can remain the same.
For a horizontal bar chart, check bar order and readable labels after resizing. After making the chart larger, check that readers can still understand its values.
Give support the printer comparison and a sample
If all chart sheets are affected, record the Excel version and the default printer's exact name. Include whether an available local printer changes the result and whether the same workbook looks normal on another computer.
When only one file fails, make a sample with invented data and the same chart-sheet behavior. Share that with your service desk or Microsoft Support instead of sending private business records.
Ask them to check chart-sheet sizing against the printer driver, not simply to recreate the chart. The original report involved several previously working files, and the confirmed successes came from printer changes.
The Short Version
Set an available default printer and restart Excel. Compare a local printer if needed, then check page settings. Place a copy of the chart in a worksheet while support checks a persistent printer-related fault.
Checked November 16, 2026.
 If you have any business, I can build it online