
Word can create a chart directly through Insert > Chart in the desktop app. Choose a chart type, replace the sample figures in the spreadsheet that opens, and close that spreadsheet when the chart shows your data.
Use an embedded chart, which stores its data inside the document, when you want to send one self-contained file. If the numbers already live in an Excel workbook and need regular updates, a linked Excel chart is the other useful route.
Insert a chart where it belongs in the document
In the desktop Word app, click where you want the chart to go. Choose Insert > Chart, select a type, then double-click the design or select OK in the dialog. Word adds a chart and opens its data grid.
On Word for Mac, work in View > Print Layout when editing charts. Use Insert > Chart to choose the type and its design. The chart's editing tabs appear after you select the chart in the document.
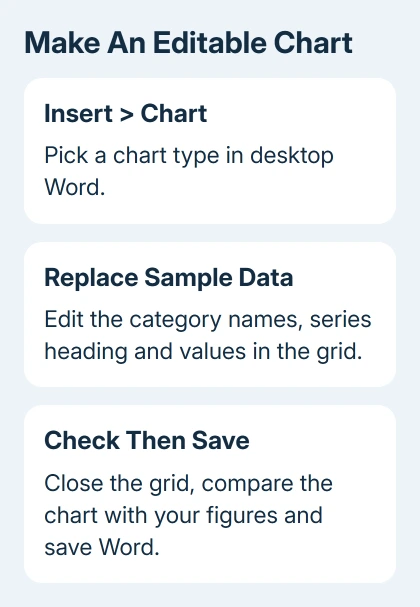
Microsoft's chart insertion instructions describe the embedded spreadsheet route. The grid supplies the chart's numbers; you don't need to draw each bar or type values into a picture.
Use a bar or column chart to compare categories. A line chart suits an ordered sequence such as monthly totals. Start with a simple design so you can check the labels and values before adding visual detail.
For example, a report comparing three departments needs three category labels and the corresponding figures. Add another colored series, or set of values, only when you have another set to compare.
Replace the sample labels and values together
In the spreadsheet, replace the category names with your own labels. Replace the series heading too. A chart labeled Series 1 or Category 1 still contains sample content that needs replacing.
Enter the numbers in the cells next to the labels. Use the same units throughout each series. If the numbers are amounts in dollars, make that clear in the chart's title or axis label rather than leaving the reader to guess.
Check the outlined data range in the editing spreadsheet. It should include all the labels and values you want plotted. If you add another category outside that range, adjust the selection so the chart includes it.
Remove unused sample rows and columns from the chart's data selection. Empty-looking space and an extra sample series can both change the chart's meaning, especially when the legend still lists a series you didn't intend to use.
Close the spreadsheet window when you've finished entering data. The chart remains in Word. Save the document, then check that the displayed category names and figures match the source you used.
If arranging the data is the difficult part, the Excel chart preparation guide explains how labels and series work. The same distinction matters when Word opens an Excel-style grid for an embedded chart.
I'd check one category by hand before formatting anything. Comparing one plotted value with its original cell catches a wrong range much faster than adjusting colors on an incorrect chart.
Reopen the data when a number changes
Select the chart in Word and open Chart Design > Edit Data. Depending on the version and chart, the menu can also offer Edit Data in Excel. Use that command when you need to change the numbers the chart uses.
On Mac, select the chart and use Chart Design to reach its data controls. Editing a value in the associated Excel sheet updates the chart shown in Word. Return to the document and check the affected category afterward.
Changing a visible chart title doesn't change the underlying values. Similarly, adding a text box over a bar won't correct its height. Make numeric corrections in the data grid so the picture and figures agree.
If the chart includes the right figures but compares the wrong groups, check how its data is arranged into categories and series. Try a small sample with two categories to see how the chart reads your rows and columns.
The bar chart guide explains category comparisons and stacked totals. Use that distinction when one bar contains several parts instead of a single independent value.
Add labels and position the chart beside the text
With the chart selected, use Chart Design > Add Chart Element for items such as a title, axis titles or data labels. Each chart type offers a different set of elements.
On Windows, the Chart Elements button beside the selected chart provides another route. Don't expect an axis-title option for a chart type without axes, such as a pie chart.
Name the comparison in the chart title. Add units where they change the meaning of the numbers. A legend is helpful for several series, but one plainly labeled series may need fewer explanations.
Use Layout Options to choose where the chart sits in relation to your text. An inline chart behaves more like a large character in its paragraph; wrapping choices let text flow around the object.
Resize from a corner and review the labels after resizing. A chart that fits the page but has unreadable category names still needs adjustment. A simpler chart or more page space is often better than shrinking all its text.
Link an existing Excel chart when updates should carry through
Open the workbook containing the finished chart, select the chart and copy it. Click where you want it in Word and paste. Inspect the Paste Options rather than assuming every paste creates the same connection.
Choose a Link Data option when the Word chart should follow its Excel source. Choose an Embed Workbook option when the data should travel inside the Word file. Theme options control its appearance.
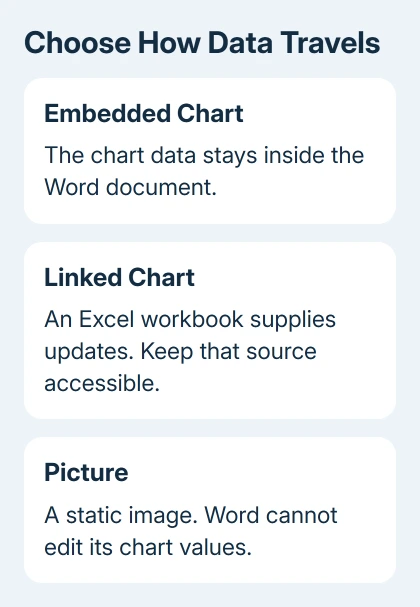
A Picture paste gives you an image. It can be resized, but Word's chart data commands can't edit its numbers. Use that option only when a static image is what you intend to send.
If you link the chart, keep the original Excel workbook available. Select the chart and use Chart Design > Refresh Data when you need to bring through a change. A recipient without the source may not be able to update it.
The linked and embedded chart explanation describes that storage difference. Before sending a linked report, check the current displayed values and whether the recipient needs the source workbook.
Handle a missing Chart command in the web app
These creation steps apply to desktop Word. If Word in your browser doesn't offer the required Chart tools, switch to desktop Word for that document. Don't look for an identical Excel editing window in every browser version.
When the selected object only offers picture formatting, check whether someone pasted an image instead of a chart. Ask for the editable document or original workbook if the values need correcting.
If the object is an editable chart but its data won't open, give Microsoft 365 support the Word version, operating system and whether the chart is embedded or linked. Include the error and whether its source workbook opens normally.
The Short Version
Insert a chart in desktop Word, replace its sample data and check the plotted values. Use Edit Data for later corrections. Choose embedded data for a self-contained document or a linked chart when an Excel workbook should supply updates.
Checked November 9, 2026.

Isaac Smith is the founder and editor of PC Glance, a website that covers computers, laptops, and technology. He is a tech enthusiast and a computer geek who loves to share his insights and help his readers make smart choices when buying tech gadgets or laptops. He is always curious and updated about the latest tech trends.