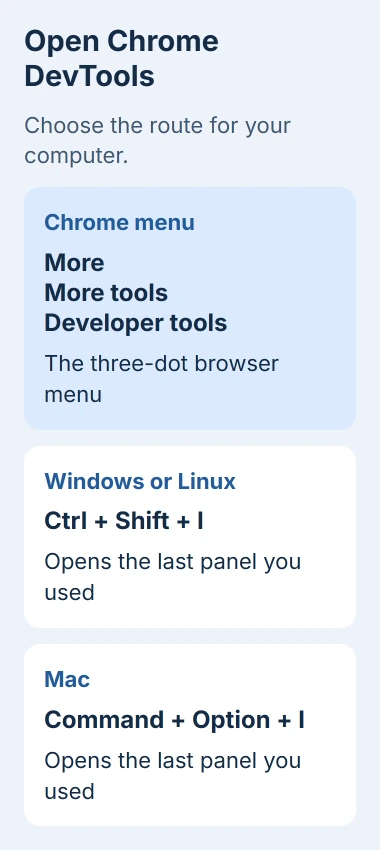
Press Ctrl+Shift+I on Windows or Linux, or Command+Option+I on a Mac, to open Chrome's developer tools for the current tab. Chrome's top-right menu also offers More > More tools > Developer tools.
DevTools opens beside your page or in a separate window. If someone helping you asks for the Console or Network panel, select that panel after opening the tools.
Open the tools for the tab you want to check
Select the Chrome tab with the problem, then press the shortcut for your operating system. The tools belong to that tab, so opening them on another tab won't show the original page's errors or requests.
For a harmless practice page, open Example Domain in a separate tab. It has one short paragraph, making it easy to see which part of the page you've selected.
The shortcut reopens whichever panel you used last, which might not be Console. Check the panel names before assuming the shortcut failed because the window looks different.
Google says F12 also opens DevTools on Windows and Linux in its Chrome keyboard shortcuts. Some laptops use F12 for a hardware control instead, so Ctrl+Shift+I is easier.
The Chrome shortcut reference covers moving between tabs and around the browser. DevTools has its own shortcuts too, and they can behave differently while you're working inside the tools.
Use the menu when a shortcut does something else
Click Chrome's three-dot More menu beside the address bar. Open More tools, then choose Developer tools. Use the browser's menu, rather than a menu drawn inside the website.
Try the menu if F12 changes your laptop's volume or brightness, or another app uses the same shortcut. That checks whether DevTools can open without changing your keyboard settings.
If the menu works, keep using it while you check the shortcut. I'd check for another program using that key combination before reinstalling Chrome.
Work or school administrators can restrict DevTools. If Developer tools is missing or disabled on a computer they manage, ask IT whether it's blocked on purpose before changing the browser's setup.
When Chrome itself stops responding before any menu opens, use the browser freeze checks. A frozen browser and a missing developer-tools shortcut need different repairs.
Open Elements to inspect one item on a page
Right-click a heading, paragraph or button on the page and choose Inspect. The Inspect route opens Elements with that part of the page selected.
Elements shows the page's structure, or DOM. In Styles, you'll see the CSS rules that control its appearance, including text size and spacing.
On the practice page, right-click the paragraph and select Inspect. The selected row in Elements should match it. On a page with more text, choosing another paragraph selects that part of the page instead.
The element picker is another option. Press Ctrl+Shift+C on Windows or Linux, or Command+Option+C on Mac, then select the item on the page. A highlight shows which item you're about to select.
I'd use Inspect for a single misplaced button or unreadable heading. It gets you to that item directly, instead of making you search through the whole page structure after opening the tools.
For the same inspection job in Safari on Mac, enable its web developer setting before looking for Inspect Element.
Switch to Console or Network for a support request
Choose Console when the instructions ask for page messages or JavaScript errors. JavaScript is the code behind a website's interactive features. Console is separate from Chrome's address bar and your computer's Terminal.
To restore a blocked website function, allow JavaScript through Chrome's permissions rather than entering commands in this panel.
To open Console directly, use Ctrl+Shift+J on Windows or Linux, or Command+Option+J on Mac. These shortcuts go straight to Console, regardless of which panel you used last.
Don't paste code into Console just because a stranger promises a repair or reward. Code entered there runs as part of the webpage; the browser's paste warning exists to interrupt that kind of trick.
Choose Network when support wants to see how a page loads its files. Keep the tools open, reload as instructed, then repeat whatever failed on the page. Requests won't appear in a new recording before they happen.
Move the panel, then close it when finished
A narrow browser window can leave little room for both the page and the tools. Open the three-dot menu inside DevTools and use Dock side to move it or open it as a separate window.
The placement controls let you put the tools on the left, right, bottom or in a separate window. Moving them doesn't change which website they're attached to.
If the panel names don't fit, widen the tools or look in the menu for extra panels. Console may be there because there isn't room for it in the visible row.
Close DevTools with its own close control when you're done. Closing a separate DevTools window leaves the inspected webpage open. Escape opens or closes a lower panel inside the tools, so it won't close DevTools itself.
Before sharing a screenshot or exported diagnostic file, check the support team's privacy instructions. Account pages and network records can include private details that a public forum doesn't need.
If the tools still won't open through either the menu or shortcut, note your Chrome version and whether the browser is managed. Give those details to Chrome Help or your administrator, along with the route that failed.
The Short Version
Open the affected tab, use Ctrl+Shift+I or Command+Option+I, and select the panel you need. The menu offers the same opening route, while Inspect jumps straight to one page element. Close the tools after the check.
Checked November 5, 2026.

Isaac Smith is the founder and editor of PC Glance, a website that covers computers, laptops, and technology. He is a tech enthusiast and a computer geek who loves to share his insights and help his readers make smart choices when buying tech gadgets or laptops. He is always curious and updated about the latest tech trends.