
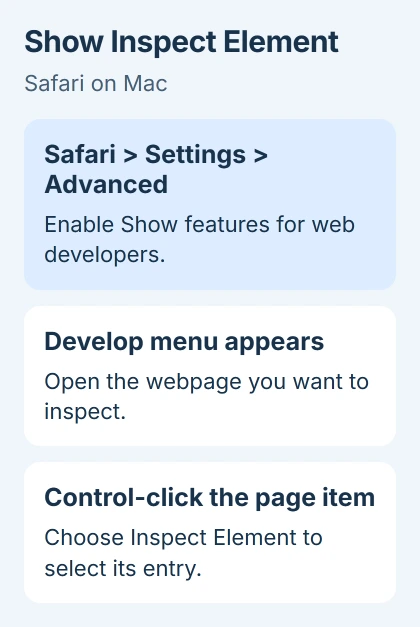
Safari hides Inspect Element until you turn on its web developer features. Open Safari > Settings > Advanced to enable them, then Control-click the part of a webpage you want to inspect and choose Inspect Element.
The inspector shows how the page is built and styled. You can check a font, spacing or an element's HTML code without another app. Changes you make there usually affect only your view until the page reloads.
Enable Safari's inspection controls
Open Safari and choose Safari > Settings from the Mac menu bar. Select Advanced, then enable Show features for web developers. A Develop menu should appear in the menu bar.
Apple says to enable that checkbox in its Safari developer-tools instructions. Some older releases call it Show Develop menu in menu bar. Use the wording your version shows.
This setting turns on a feature in Safari. It doesn't enable a menu in Chrome or change whether your Mac login account is an administrator.
Open a webpage before trying the next step, then return to it from Safari Settings. I'd start with a page you recognize so it's easy to match a heading with its entry in the inspector.
Select the exact text, image or control
Place the pointer over the item on the webpage. Control-click, or use your trackpad's secondary click, then select Inspect Element. Safari opens Web Inspector with that page item selected.
If you clicked an image or link, look for Inspect Element in the menu that opens. Starting with the item you want saves you searching all the page's code for it.
Another route is Develop > Show Web Inspector, or Option + Command + I. The Web Inspector setup reference lists those routes alongside Inspect Element.
If the shortcut doesn't select the item you want, go back to it on the page and Control-click it. Opening the inspector alone doesn't always select the text or image you had in mind.
If the shortcut does nothing, click the Safari webpage and try again. When Settings or another app is active, the shortcut may go to that window instead.
Read the Elements view without getting lost
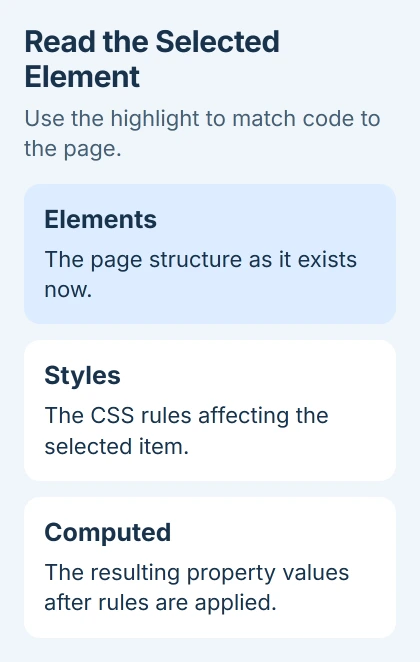
Choose the Elements tab if another inspector tab is open. Its main list shows the page's DOM, the way its headings, paragraphs, buttons and other items are currently arranged.
Expand an entry to see the items inside it. Hover over an entry to highlight its area on the webpage. That shows whether you've selected a whole group of items or just the text or image you wanted.
The Elements reference explains why this view follows changes on the page. Scripts can add or change items after loading, so it can differ from the HTML the server first sent to your browser.
To check a font or color, keep the text selected and look in Styles. That panel lists the CSS rules applied to it. CSS is the set of instructions that controls the page's appearance.
Use Computed to see which value the page actually uses for your selection. Several rules can mention font size, for example, but the computed value shows which size takes effect.
Try a small appearance change, then reload
On a page you own or use for practice, select some text and change one setting in Styles. A color change is easier to spot than several changes to the page layout at once.
Watch the page as you make the change. If the wrong area changes, select the intended element again before making more edits. A container's styling can also affect the elements inside it.
Inspector edits don't change the site's source files. Refreshing or leaving the page normally removes these temporary style changes. To keep a change on your own website, edit its source files through your usual process.
Before experimenting with an important form, finish or save its contents. Reloading to discard an inspection change can also discard text you entered on the page.
Close Web Inspector when you've finished. If you changed the webpage's styling, reload the page to restore its normal appearance. Closing the inspector alone won't undo those changes.
Use Chrome's own inspector when Chrome is the browser
For a page open in Chrome on Mac, Control-click the item and choose Inspect. Chrome uses DevTools rather than Safari's Web Inspector, and it doesn't require Safari's Advanced checkbox.
The Chrome developer-tools guide covers its menu and keyboard shortcuts. Use it for a problem in Chrome; inspecting the page in Safari won't show how Chrome displays it.
Start in the Elements panel for a page's structure and styles. For JavaScript errors or messages, open the Chrome Console instead.
When Inspect Element is missing or nothing is highlighted
Return to Safari > Settings > Advanced and check that the developer checkbox is still enabled. Then open the webpage and try the Develop menu. This checks whether the tool can open even when Inspect Element is missing from the context menu.
If the wrong area is selected, choose the item again on the page and watch its highlight. Page items can sit inside other items, so selecting the surrounding container can highlight more than you expected.
If the inspector text is hard to read, check its Settings > General > Zoom control. The inspector settings reference explains this setting, which is separate from the webpage's own zoom.
If a managed Mac blocks the setting, ask its administrator. For a personal Mac where Web Inspector still won't open, give Apple Support the macOS and Safari versions, the page address and whether the Develop menu appears.
The Short Version
Enable Safari's web developer features in Advanced settings, then Control-click a webpage item and choose Inspect Element. Use Elements and Styles for its structure and appearance. Reload to discard temporary page changes.
Checked November 5, 2026.

Isaac Smith is the founder and editor of PC Glance, a website that covers computers, laptops, and technology. He is a tech enthusiast and a computer geek who loves to share his insights and help his readers make smart choices when buying tech gadgets or laptops. He is always curious and updated about the latest tech trends.