
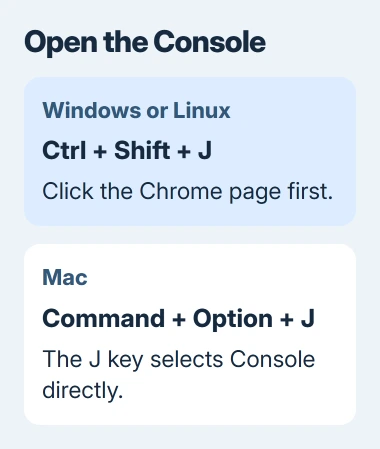
Press Ctrl+Shift+J on Windows or Linux, or Command+Option+J on a Mac, to open Chrome's JavaScript Console. Click the page first so the shortcut goes to Chrome. The Console appears inside Developer Tools, often shortened to DevTools.
The J shortcut takes you straight to the Console, even if you last used a different developer panel. It works with website JavaScript and doesn't require Java.
Open the Console for the page you need
Make the page you're checking the active tab in Chrome. Hold Ctrl and Shift, press J once, then release the keys. On a Mac, hold Command and Option while pressing J.
Google lists those combinations in its DevTools opening reference. The tools may open beside the webpage, underneath it or in a separate window, depending on where you last placed them.
Look for the selected Console tab and a prompt where you can type. Warnings or errors may already be there. If you see them, the tools have opened and are showing messages from that page.
Opening the tools won't fix the website. You can use them to read its messages or run JavaScript commands. If support only needs an error report, start with the log.
For everyday tab and navigation commands, use Google's shortcut list and the Chrome keyboard reference. These cover browsing shortcuts separately from developer controls.
Reach the same tools through Chrome's menu
If the shortcut doesn't work in Chrome, open the three-dot menu beside the address bar. Select More tools > Developer tools, then click Console in the tools that open.
The menu may reopen the developer panel you last used. If Elements or Network appears first, select Console without closing and reopening the tools.
You can also right-click part of a webpage and choose Inspect. That opens Elements to show that part of the page, so you'll still need to select the JavaScript Console.
Safari users can open Web Inspector from a selected page item after exposing the Develop menu in Advanced settings.
Likewise, F12 or Ctrl+Shift+I can return to the last panel. On Mac, Command+Option+I does that job. Use the J shortcut to go straight to the Console.
Try the menu in a regular Chrome window if a remote desktop, document editor or another app uses the shortcut instead. If the menu works, the tools are available; the shortcut just isn't reaching Chrome.
If your school or employer manages the profile, ask its administrator about missing or blocked developer controls. Reinstalling Chrome to get around that restriction isn't the next step.
Keep another panel open with the Console drawer
You can keep another developer panel visible and open the Console in a drawer underneath it. Click inside DevTools and press Esc to toggle that drawer.
This lets you check a failed request in Network while reading its Console error. If you've clicked outside the tools, Esc may act on the webpage instead.
The Console's panel and drawer instructions describe both layouts. The drawer is another way to show the Console, rather than a separate extension.
The DevTools three-dot menu also offers Show Console Drawer. Use it if you'd rather click a menu command than press Esc.
If the webpage and tools feel cramped, use the DevTools menu to move the tools. Give the log enough room to read the whole error before choosing what to send to support.
Make an empty Console show the messages you need
Check that the Console is open for the right tab. Each page has its own messages, so another tab's Console won't show what happened on the page you're checking.
Clear any text in the Filter box. In the log-level menu, select Errors, Warnings and Info as needed. If a message type is hidden, the Console can look empty even when the page has messages.
To keep messages when you navigate or reload, open Console settings and enable Preserve log. Without that setting, loading another page normally clears the Console.

Turn the setting on before you repeat the action that failed. Try it once so the log shows one attempt, rather than unrelated messages from several visits.
For a browser crash showing Aw, Snap, record its displayed code too. The Chrome crash-code checks cover repairs for a browser crash rather than a JavaScript error on a website.
Save the report and leave pasted code alone
Right-click a blank area in the Console and choose Save as… to save the messages in a .log text file. Copy console copies the current log.
Read through the report, which can include page addresses or details from your session. Send the relevant error and what you did when it appeared through your chosen support channel.
A red error doesn't necessarily mean you caused the problem. Give the website's support team the error text, your Chrome version and the steps that brought it up. They may need to fix the site itself.
If Chrome blocks pasted code with a warning, stop and check who supplied the code and what it does. The Console paste warning protects against instructions that can act through your signed-in account.
I'd stick to reading and saving the log unless you understand what a command does. Don't run an unfamiliar script just because it promises a hidden feature or an instant account fix.
Once you've saved the report, click DevTools' close button to give the webpage its space back. If the error still happens, report it to support; reopening the tools won't fix it.
The Short Version
Use Ctrl+Shift+J on Windows or Linux and Command+Option+J on Mac. The menu route is More tools, Developer tools, then Console. Check filters and Preserve log when collecting an error, and review a saved report before sharing it.
Checked November 5, 2026.

Isaac Smith is the founder and editor of PC Glance, a website that covers computers, laptops, and technology. He is a tech enthusiast and a computer geek who loves to share his insights and help his readers make smart choices when buying tech gadgets or laptops. He is always curious and updated about the latest tech trends.