Resetting the histogram's style can let Excel 2016 save a workbook affected by the old chart-saving fault. Right-click the chart and choose Reset to Match Style, then save a separate copy; an owner confirmed that workaround worked.
An update fixed the original fault, but later replies reported failures on newer builds. Try the style reset and current Office updates, then compare this histogram with a chart in a new workbook.
In this guide
1. Reset the histogram's style and save a copy
Keep the workbook open while you try the workaround. Select the histogram chart itself, right-click it, and choose Reset to Match Style from the chart's shortcut menu.
This can change custom chart formatting. Note any colors or other appearance changes you need to restore, but concentrate first on getting a usable saved copy of the data and chart.
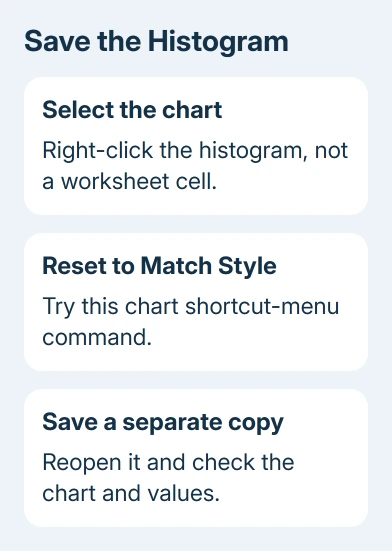
Use File > Save As > Browse, choose a different filename, and keep the file format your workbook needs. An ordinary workbook can use .xlsx; a workbook containing VBA needs a macro-enabled format such as .xlsm to retain its code.
A recovered copy needs checking before you rely on it. The original report included a repair log saying that some data might have been lost or corrupted after the attempted save.
Close the new copy only after saving succeeds, reopen it, and check the source cells and histogram. The file should retain both its values and the chart, with no repair prompt on opening.
In December 2016, one owner confirmed the style-reset workaround in Microsoft's discussion. Another owner later reported that applying a custom chart template helped a pie-chart save, but that isn't confirmation for this histogram command.
If Reset to Match Style isn't offered, make sure you selected the chart rather than a worksheet cell. A menu for the cell won't contain chart-formatting commands. Then continue with the Office version check.
2. Get Excel's available fixes
Open File > Account > Update Options > Update Now in Excel. Choose Enable Updates first if needed, then run the update check. Close Office programs when the updater asks.
The original histogram fix was released for 16.0.7571.2072 or later builds. A follow-up the next day reported being able to change and save the histograms again.
That is the historical fixed build for this particular report, not a build to seek out today. Use the current update route for your installed edition and record its version under File > Account > About Excel.
The vendor's Office update instructions also explain missing update menus. If your company controls updates or uses a volume-license installation, have IT review the approved update package.
Retest the same workbook after updating. Save a copy, close it, and reopen it. If it still fails, keep the exact build number with the error message rather than assuming that every histogram fault has the old cause.
Later owners reported chart failures on Version 1707 Build 8326.2096, and another reported problems with modified histogram bins. Those later reports mean the first fix didn't settle every similar symptom.
I'd try the style reset before rebuilding the chart. It's quick and gives the existing chart a chance to save without rebuilding it.
3. Find out whether one chart or all charts trigger it
In a new blank workbook, enter a small set of sample numbers and insert a histogram. Use Insert > Insert Statistic Chart > Histogram, then save that test file locally.
Reopen the test file and check the chart. If this simple histogram saves while the original doesn't, the failure is more specific to the original workbook or its chart settings, rather than every histogram you insert.
For the creation steps and bin controls, use the histogram setup guide. Bins are the number ranges used to group the measurements into the chart's bars.
Record whether the affected chart uses automatic bins, a fixed bin width, or a selected number of bins. A later owner reported a recovery prompt with customized bins and found the recovered histograms empty.
Check the recovered chart's data with that reported failure in mind. It doesn't mean automatic bins will fix every chart. Keep the settings you need in the original workbook and use a spare copy for comparisons.
If other chart types fail too, record that difference. The later discussion included broader chart-saving failures, so a problem with every chart shouldn't be described to support as histogram-only.
An explicit memory or disk-space message belongs with the separate Excel open-and-save error checks. Keep the exact wording rather than treating all save errors as the same problem.
4. Rebuild a failed chart in a working copy
When a simple new histogram saves but the original doesn't, duplicate the workbook before removing a chart. If necessary, copy the source measurements into a fresh workbook and save that data first.
Insert a new histogram from those cells and save again before applying custom formatting. Add the required bin settings and labels in stages, saving between changes. This shows which change brings the failure back.
These steps don't repair the old chart itself. They give you a fresh chart if only the old one fails, or an example you can send for help if a particular setting brings the error back.
CSV doesn't keep charts or the full workbook structure. Use a workbook format for the finished file so you keep the histogram you need.
If the source workbook contains multiple sheets, formulas, or macros, check those separately in the recovered copy. The chart looking correct doesn't confirm that a repair preserved the workbook's other contents.
When the chart still prevents saving
Send IT or the workbook maintainer the affected file, Excel edition and build, exact save error, and a small new workbook that shows the same problem. Use values that aren't confidential in any example shared outside the organization.
Include whether the style reset helped and whether the error appeared before or after custom bin settings. Those details help them tell the old style problem apart from later chart failures.
The original asker tried both Office repair options without success. If your result is unchanged too, don't keep cycling through repairs instead of supplying the chart example.
Support for Office 2016 ended on October 14, 2025. Ask IT to open your sample in a currently supported Excel release and plan an upgrade if the old product remains the only one failing.
The Short Version
Try Reset to Match Style and save under another filename, then apply available Office updates. Reopen the file to check its chart and values, then compare a simple new histogram if the failure remains.
Checked November 17, 2026.