

To make a histogram in Excel, select the individual measurements and choose Insert > Insert Statistic Chart > Histogram in the Windows desktop app. Excel groups the values into ranges and counts how many fall in each range.
Use the original observations, such as each delivery time, rather than a table of totals already grouped by range. After inserting the chart, adjust its bins so the intervals answer the question in your report.
Select measurements before inserting the chart
Put the values in one column with a descriptive heading. Each row should contain one observation in the same unit. Leave any total or average outside the selected range.
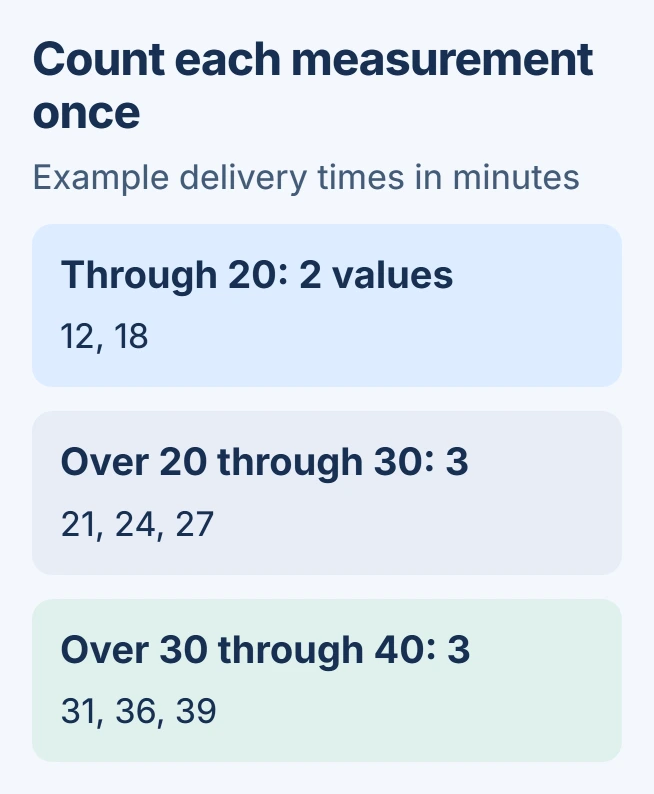
For practice, enter 12, 18, 21, 24, 27, 31, 36 and 39 in eight cells, one value per cell. These are invented delivery times in minutes. Select those eight numbers before opening the chart controls.
Status: Histogram insertion and bin controls reviewed November 1, 2026 in Microsoft support. Example counts were checked with Python; no Excel session was used.
Microsoft documents the built-in Histogram chart separately from the older Data Analysis tool. The ordinary chart does not require loading the Analysis ToolPak.
For categories with existing totals, such as monthly order counts, use an ordinary Excel chart. Feeding those totals into a numerical histogram analyzes the totals themselves.
Insert Histogram on Windows, Mac or the web
In Windows desktop Excel, choose Insert > Insert Statistic Chart > Histogram. Select Histogram rather than Pareto. The resulting horizontal axis represents value ranges; column heights represent their frequencies.
On Excel for Mac, open Insert, select the statistical chart icon and choose Histogram. In Excel for the web, Microsoft's route is Insert > Statistical > Histogram.
Select the chart to reveal its editing controls. Replace its title with the subject and units, such as Delivery time distribution (minutes). Check that the selected source contains every intended observation exactly once.
Set the ranges on the horizontal axis
In desktop Excel, right-click the horizontal axis, select Format Axis, then open Axis Options. If the controls refer to the vertical scale, select the horizontal labels instead.
Choose Bin width to specify an interval size, such as 10 minutes. Choose Number of bins when the desired number of groups matters more. Automatic lets Excel select the grouping.
Microsoft says Underflow bin includes values equal to its cutoff or smaller. Overflow bin groups values greater than its cutoff. These settings prevent distant values from stretching the ordinary ranges.
For the practice data, a cutoff of 20 collects 12 and 18. The interval greater than 20 through 30 contains three measurements, as does the interval greater than 30 through 40. All eight measurements are accounted for.
That manual count is a check on the represented data, not a reason to force every dataset into these intervals. A useful width depends on what the measurements mean.
Need a frequency table as well as a chart?
The desktop Analysis ToolPak provides a separate Histogram analysis. Microsoft states that its tools generate result tables and, in some cases, charts. Use it when the counted intervals must also appear in worksheet cells.
On Windows, open File > Options > Add-ins. Set Manage to Excel Add-ins, select Go, check Analysis ToolPak, then confirm. Microsoft's ToolPak instructions also cover installation prompts.
On Mac, choose Tools > Excel Add-ins, enable Analysis ToolPak, then restart Excel. The Data Analysis command appears on the Data tab; its Histogram analysis accepts measurements and optional bin limits.
For that separate tool, bin limits are the upper ends of the intervals. Microsoft's analysis reference explains its frequency output. Keep it separate from the native chart's axis controls.
Check the meaning before sharing
Use a histogram to inspect the shape of the measurements. When the report also needs one number describing spread, calculate standard deviation in Excel using the appropriate sample or population formula.
If valid numbers still produce unexpected counts, retain a small nonconfidential example for Microsoft Support. Include the source range, Excel version, chart type and bin settings so the same result can be reproduced.
The Short Version
Select individual numerical observations, insert Histogram and set the horizontal-axis bins. Count a small example by hand before trusting a larger result. The Analysis ToolPak is an alternative when a worksheet frequency table is required.

Isaac Smith is the founder and editor of PC Glance, a website that covers computers, laptops, and technology. He is a tech enthusiast and a computer geek who loves to share his insights and help his readers make smart choices when buying tech gadgets or laptops. He is always curious and updated about the latest tech trends.