

An Excel software issue tracker needs a fixed ID, steps to reproduce the fault, an owner, and a status for each issue. Copy the header row into a blank sheet, format it as a table, then add status lists to keep updates consistent.
This layout suits a small team tracking problems in an app, website, or internal tool. It keeps the report, assignment, and retest result together without requiring macros or a separate project-management account.
In this guide
Copy the issue-log headers into a blank sheet
Open a new workbook in Excel and rename the first worksheet Issues. Select A1, then copy and paste this tab-separated header row. It should fill columns A through N, with one heading in each cell.
ID Summary Version Steps Expected Actual Severity Priority Owner Status Reported Target Retest ClosedCheck that Summary is in B1 and Closed is in N1. If everything lands in A1, undo that paste and use the column headings as individual cells instead. Don't begin adding reports while the headers are in one cell.
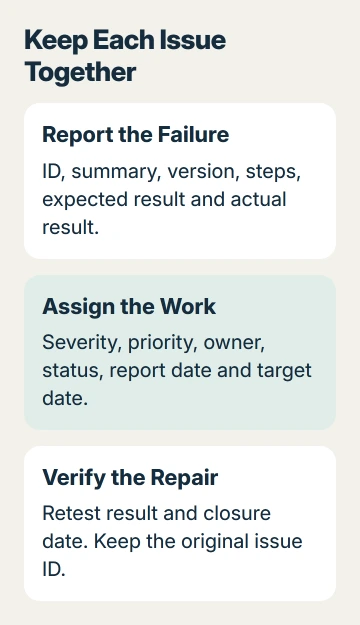
Use short IDs such as BUG-001 and BUG-002. Give each new issue the next unused ID and keep it unchanged when you sort the sheet. A row number isn't a reliable ID because sorting changes a row's position.
Keep a blank master copy before adding live reports. The headings are a starting layout, so remove a field only when your team doesn't need it. Add extra fields later when a real reporting problem calls for them.
Enter a report another person can reproduce
Start the first issue in row 2. In Summary, describe the action and failure, such as Save closes the editor without keeping changes. A specific summary lets your teammates recognize the issue without reading every cell.
In Version, record the app build and relevant operating system or browser. A fault in one Android build may not happen on Windows, and a report that omits the version is harder to retest later.
Use Steps for the smallest sequence that produces the problem. Put the intended result in Expected and what actually happens in Actual. Describe the message or behavior separately from what you think caused it.
For example, a report could describe opening a saved draft, changing its title, and selecting Save. The expected result is a saved title; the actual result is a closed editor with the previous title still present.
This sample shows how to write a report; it doesn't describe a fault in a particular product. Replace it with your own reproducible problem, and use a separate row when another failure needs different steps or a different repair.
For screenshots or logs, store the files in your team's approved location and put a useful reference in the report. Keep passwords, session tokens, and customer information out of a shared issue sheet.
Turn the range into an Excel table
Select the header row and the example issue, then choose Home > Format as Table. Pick a simple style, confirm the selected range, enable My table has headers, and select OK.
Microsoft's Excel table instructions cover Windows, Mac, and the web. A table gives each heading a filter, which is useful for showing one person's assignments or one status.
Widen Summary, Steps, Expected, Actual, and Retest enough to read them. Select those columns and enable Home > Wrap Text. Keep individual cells separate rather than merging a report across several columns.
If a wrapped report is still cut off, use the Excel row-height checks. A fixed row height can hide text even though the full description remains in the cell.
Sort through the table's heading controls so the complete issue row moves together. Sorting only the Owner cells separately would detach people from their reports. Check an ID and summary together after the first sort.
A tracker you built yourself can support an Office skills resume example by showing the table and filtering work you actually completed.
Give status, severity, and priority consistent choices
Create a second sheet called Lists. Put Open, In Progress, Ready for Retest, and Closed in A1:A4. Use the same wording throughout the workbook so filters don't split equivalent states into separate groups.
On Issues, select the cells intended for Status entries in column J. Open Data > Data Validation, choose List under Allow, then set the source to the four status cells on Lists and confirm.
On a Mac, the command can appear as Data Validation or Validate under the Data tab's tools. The drop-down list procedure also covers using a range of allowed entries.
Test the list on a sample report before applying it to the rest of your planned entry rows. Choose a status, then reopen the list to check that all four choices appear and none is blank.
Keep Severity and Priority separate. Severity measures impact, such as a crash or cosmetic defect. Priority records the team's urgency. A small visual error on a payment button can still need urgent attention.
Use simple choices, such as Critical, Major, Minor for Severity and High, Medium, Low for Priority. These are labels your team can choose, rather than an industry grading standard. Agree what each means before comparing reports.
Assign, review, and retest each issue
Put one responsible person in Owner, even when several people will help. Enter the report date in Reported and an agreed date in Target. Format those columns as dates so you can sort them meaningfully.
Use the Status filter to review Open work, then filter Owner for a person's assignments. Clear filters before assuming an issue has disappeared; an active filter can hide it while the record remains in the table.
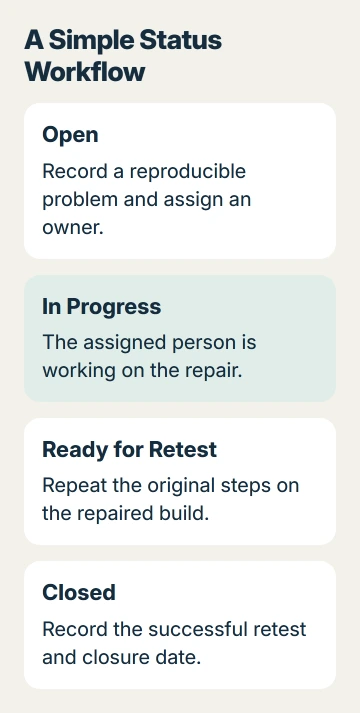
When someone makes a repair, change the status to Ready for Retest. In Retest, record the build checked and whether the original steps now produce the expected result. Enter the closure date only after the issue has been accepted as fixed.
If it still fails, return it to Open or In Progress, keep its ID, and record the retest result. Don't erase the original report or create another row solely because the first attempted repair didn't work.
I'd keep a small team on one agreed master workbook rather than emailing several editable copies. Confirm who maintains it and where the current version lives before people start updating separate files.
Save a reusable master and keep active work separate
For an ordinary project, save the working tracker as Excel Workbook (.xlsx). For repeated projects, remove the example report from a separate master and save that layout as Excel Template (.xltx) in desktop Excel.
On Windows, use File > Save As and select the template file type. On Mac, use File > Save as Template and choose Excel Template (.xltx). Keep the original master separate from the project workbook containing actual issues.
If you later add calculated fields, check the formula-copying rules before filling them down. A copied reference can shift, so verify it against a report whose result you already know.
Ask the project owner about a dedicated tracker when you need strict permissions, attachments, or a full change history.
If a table or list doesn't work, remove private data from a copy of the workbook and send it to Excel support. Describe the step that fails.
The Short Version
Paste the headers, add one reproducible example, and format the range as a table. Use consistent lists, keep one owner per issue, and record a retest before closure. Store the reusable .xltx master separately from the active .xlsx tracker.
Checked November 15, 2026.
 If you have any business, I can build it online